Hello and happy new year!
Welcome to the first 2024 edition of Western Water Notes.
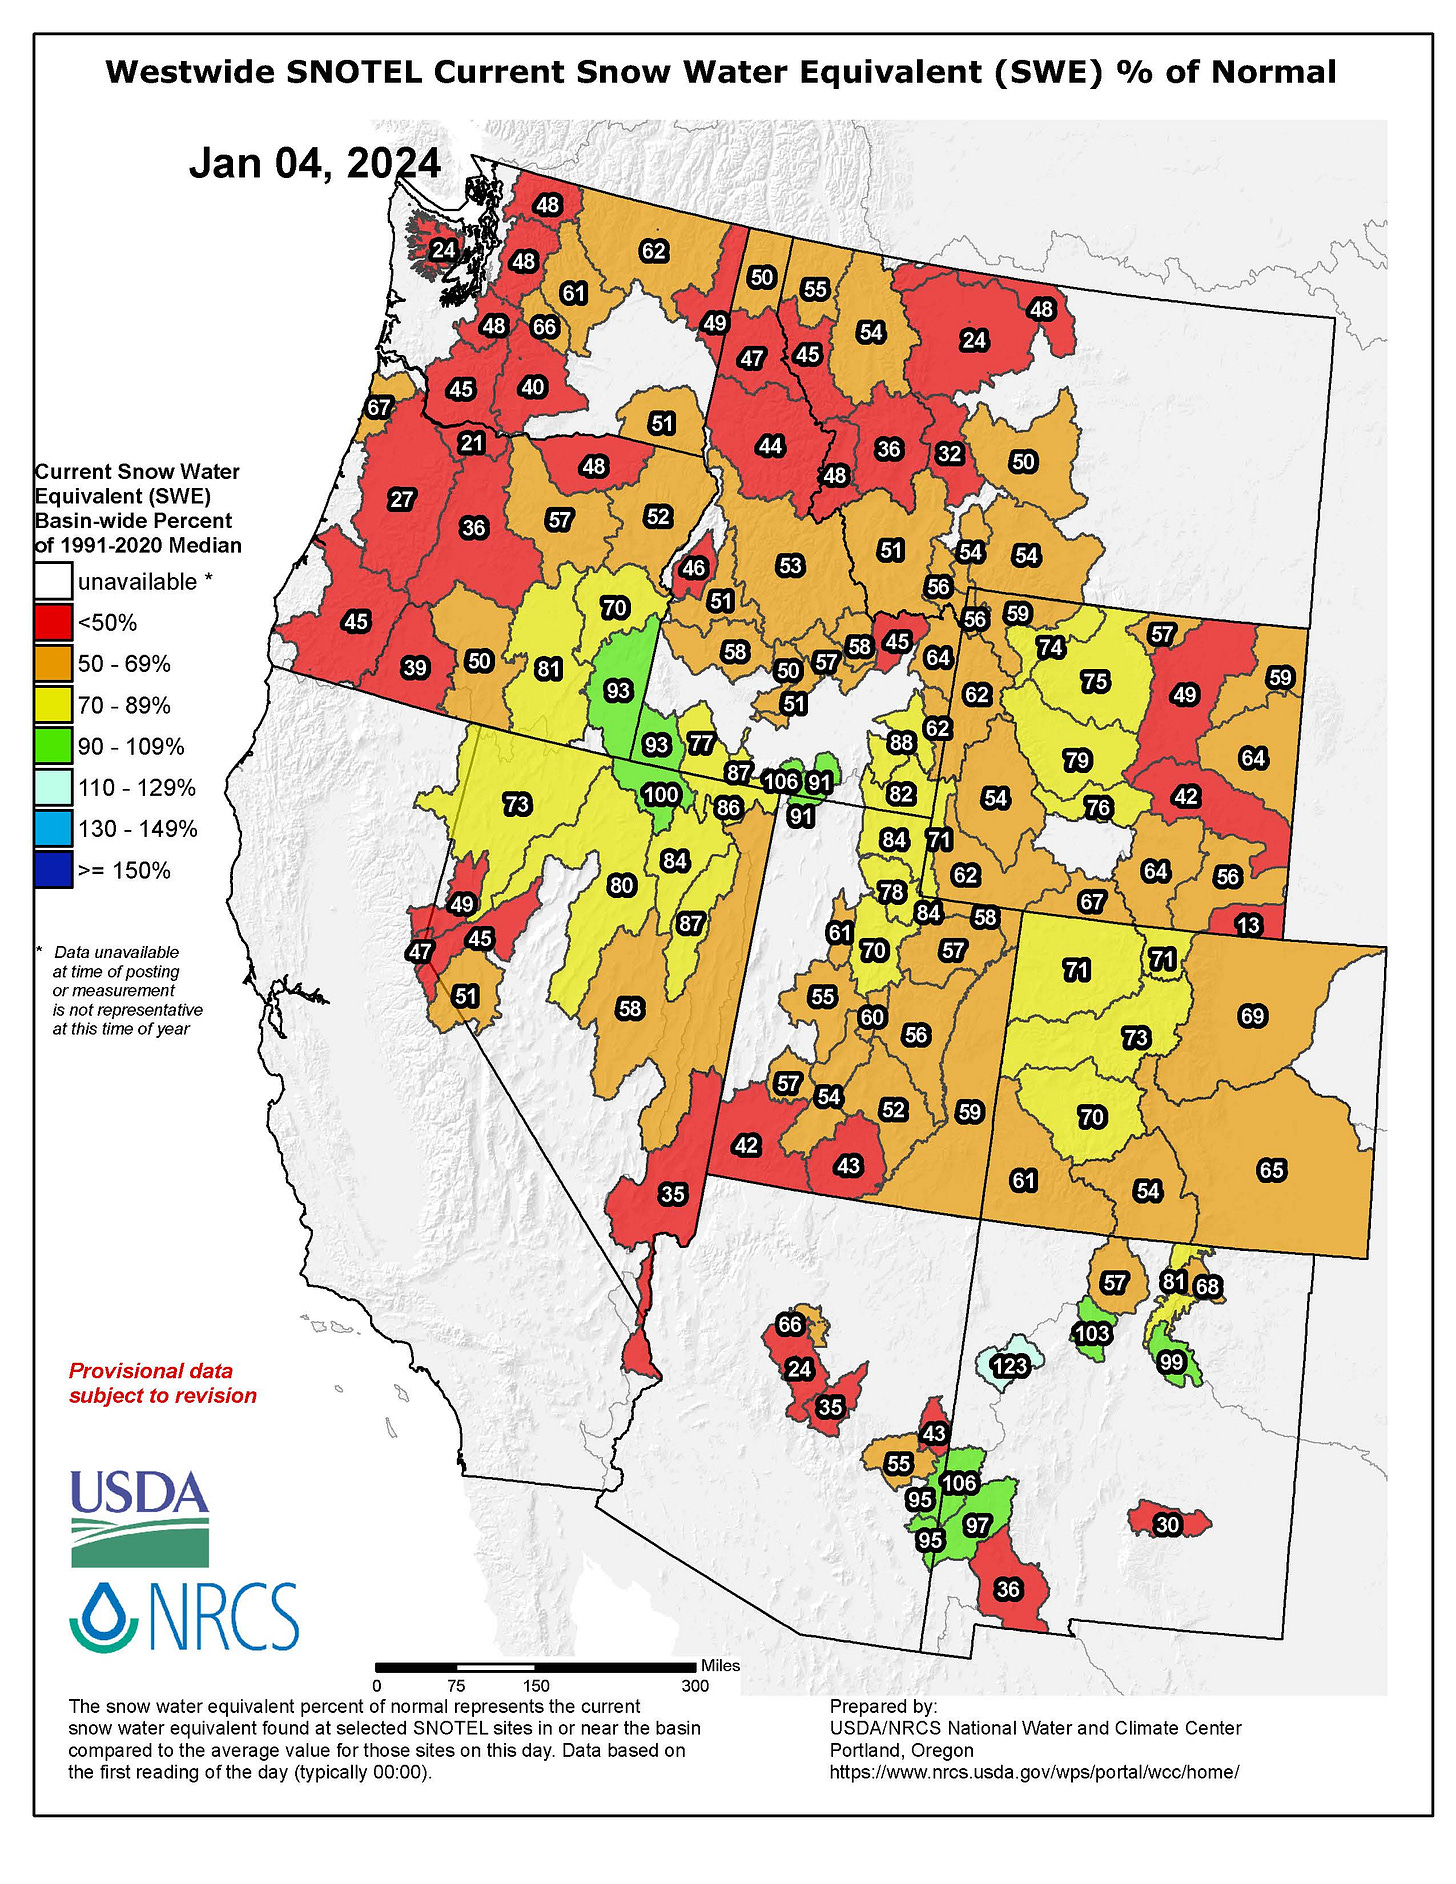
Woke up to a wonderful sight in Reno this week: A dusting of snow on the mountains. And we really need it. So far (and it’s still early in the year), it’s been a slow start to the winter across much of the West. Hoping we finally get some snow with storms forecast for later this month.
Map and chart fans, this post is for you. Lots in this edition.
If you have any suggestions of topics you’d like to see covered here, please don’t hesitate to reach out. And if you find this information useful, please share it with colleagues or friends!
You can subscribe to get this in your inbox below.
Assessing risk in Nevada’s groundwater aquifers
How do you measure the health of a groundwater aquifer?
It’s an important question for communities and ecosystems all across the country, and especially in the arid West. Water drawn from underground aquifers is used to supply drinking water, irrigate crops and support sensitive environments, including springs, plants and wildlife. Groundwater, by its nature, is invisible to us, making it hard to measure. But water managers have developed tools to evaluate groundwater health.
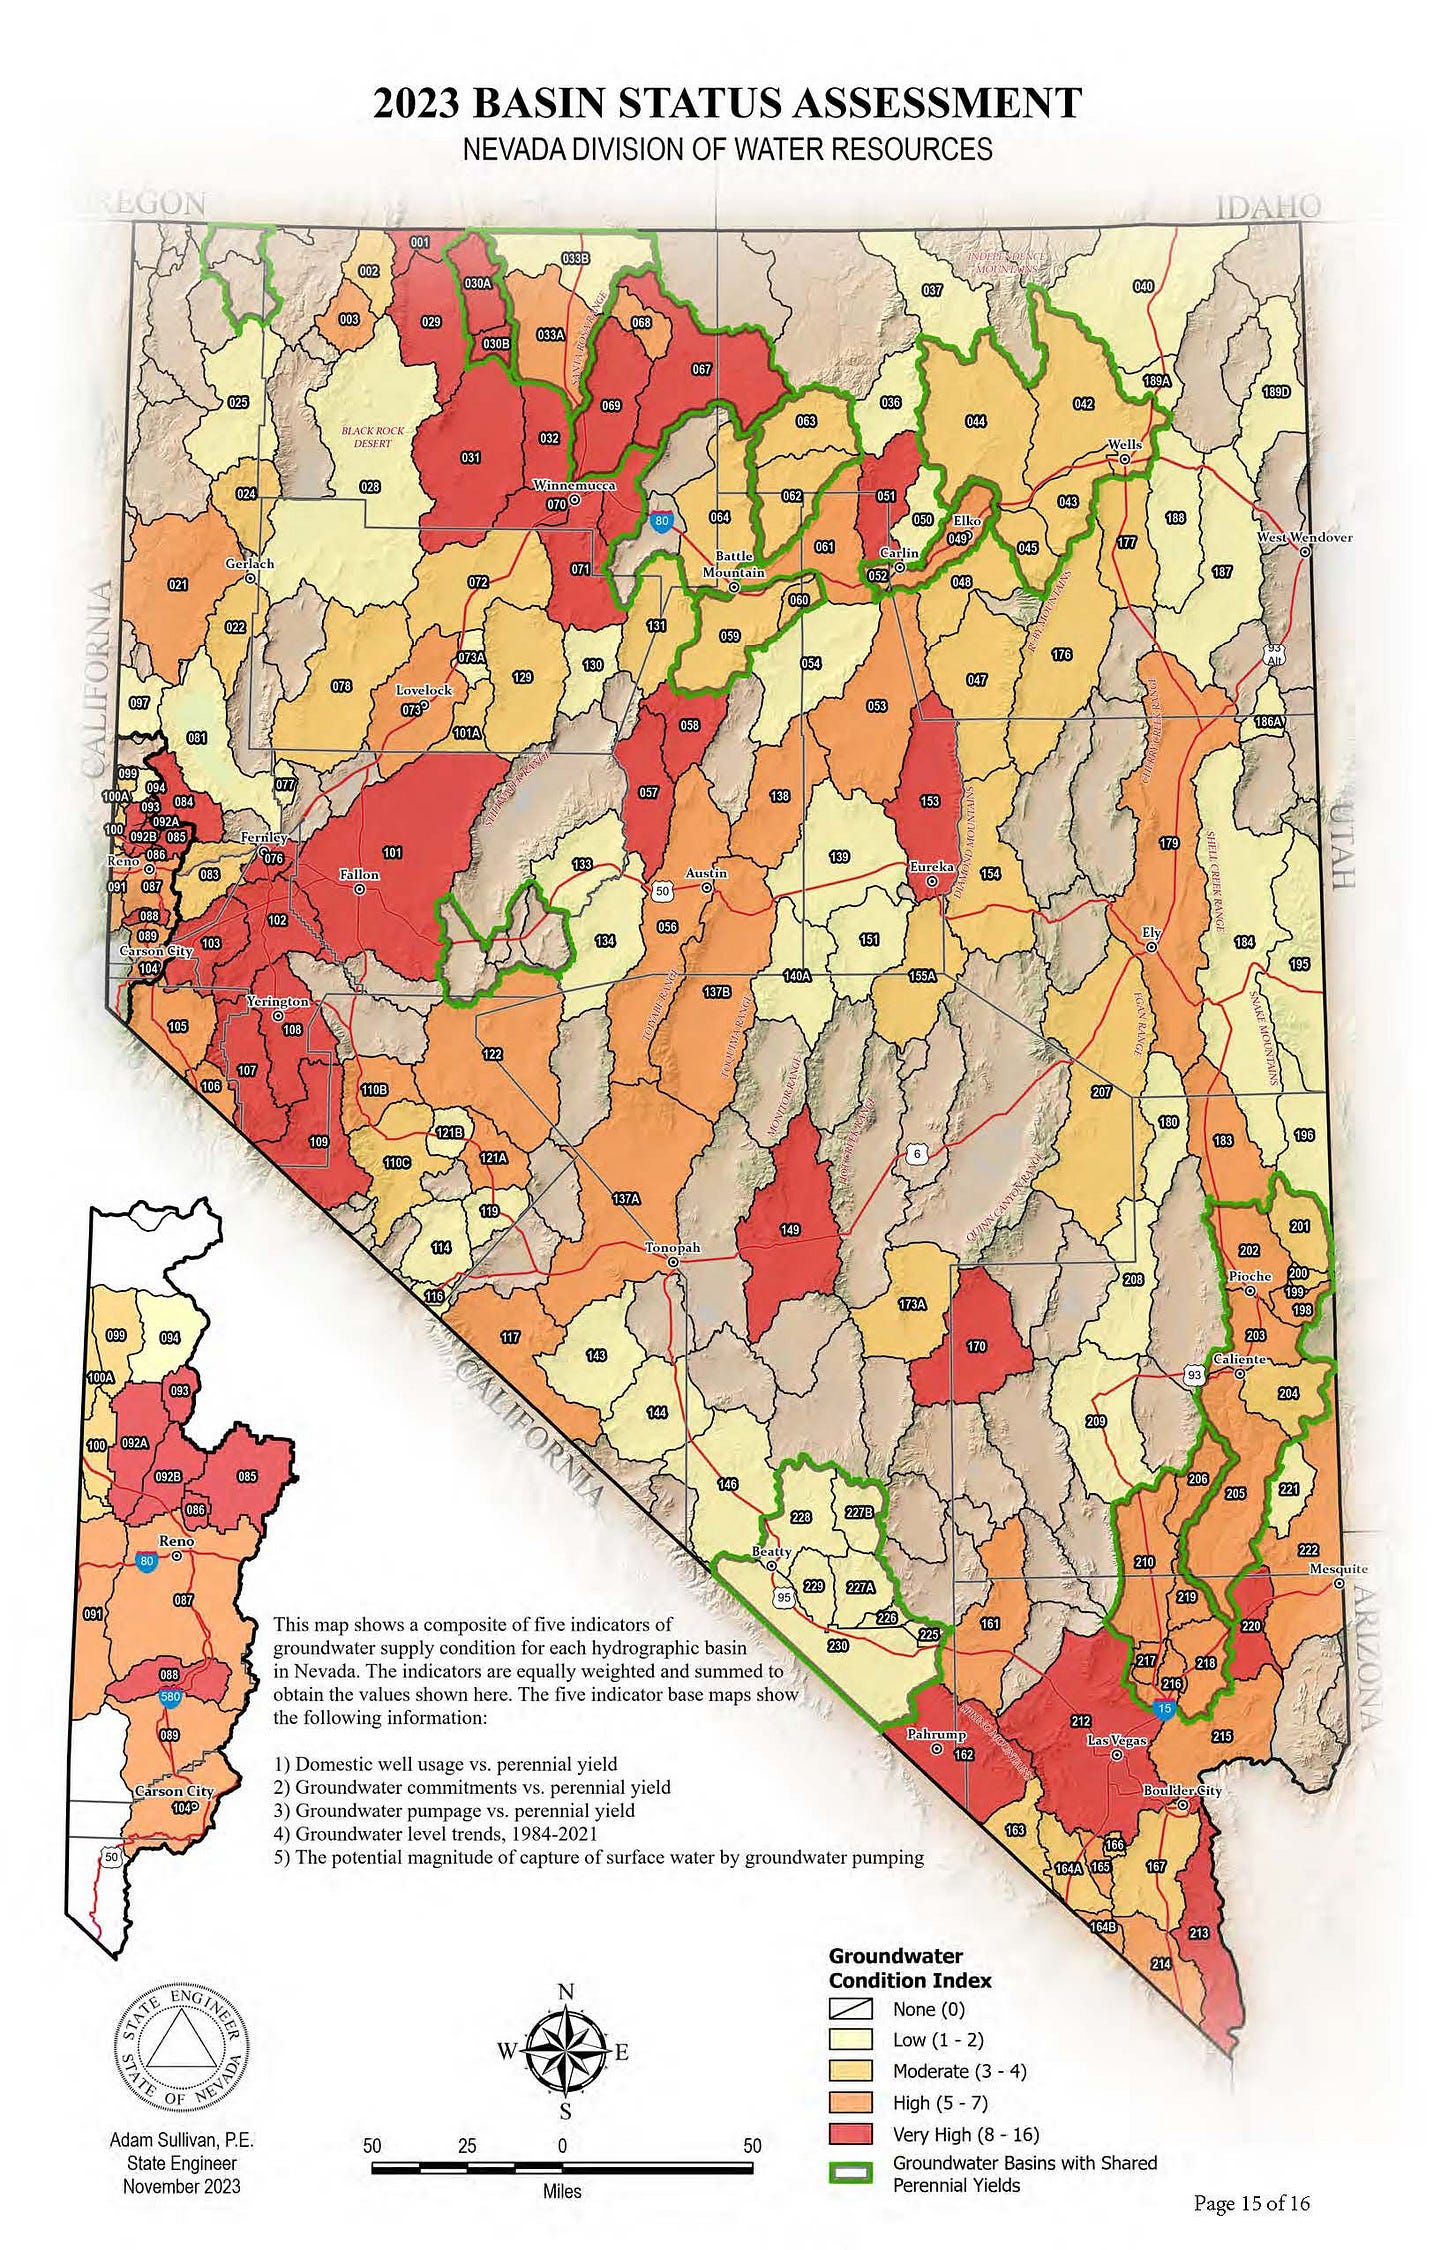
So at the end of 2023, state water regulators in Nevada unveiled a map combining five metrics meant to offer a broad look at the health of the state’s groundwater basins.
As lawmakers convened in Carson City last year, a frequent question to water officials went something like this: Where are Nevada’s groundwater issues? They often got a complicated answer because it depends on what issue you are most concerned about.
Enter the new map. It fuses together five indicators into an overall risk assessment of where water issues *could* be most pronounced. Scale matters, as with any map, and could is an important word. All the data is plotted onto Nevada’s many hydrographic basins (there are more than 250). Each area is unique and variable, and water conflicts often occurring at a localized level. That is to say, there are low-risk areas that could have conflicts and vice versa. But the map is meant to provide a very high-level view.
The map assigns each basin with an overall score applying a “groundwater condition index,” which is a composite of five indicators. On the map, light yellow represents a low classification, whereas red represents a high classification, showing that in such basins there are potentially several acute and overlapping groundwater problems.
The composite map, while not a perfect or localized reflection of groundwater issues, is notable because it provides much more data than previous maps. And a high-level look at where there groundwater stress exists could be valuable in starting a more nuanced conversation about how to address groundwater issues in the Great Basin.
Here are the five inputs the map considers and weighs equally:*
Groundwater pumpage vs. long-term supply: This indicator looks at the degree to which groundwater pumping exceeds estimated long-term supply — measured as “perennial yield.” This is the “maximum amount of groundwater that can be withdrawn each year over the long term without depleting the groundwater reservoir.” This provides a snapshot in time, relying on data from 2015 to 2017.
Groundwater level trends, 1984-2021: This indicator looks at the general trend of groundwater wells in a basin. How fast are wells declining in any one basin? It relies on state and USGS data, first analyzed for a Nature Conservancy project,
Groundwater commitments vs. long-term supply: This indicator looks at where there are more rights to pump groundwater than there is a long-term supply — again measured as “perennial yield.” Across Nevada, there are many places where there are more rights to use groundwater than can be sustained in the long-term.
Potential impacts of groundwater on streams: Groundwater pumping can leave less water in nearby streams and rivers. This indicator tries to provide an estimate of how likely it is that groundwater pumping could conflict with water running at the surface. It maps groundwater rights within a mile of perennial streams.
Domestic well use vs. long-term supply: Domestic wells have a legal framework that exists outside the permitting system for other water rights. For many, they are also a vital source of drinking water. This indicator maps places where water use from domestic wells, on its own, could exceed long-term groundwater supply.
* For much more detailed context and to spend time with each indicator, click here.
According to the state, the mapping project is “intended for public communication and general awareness of long-term vulnerability to groundwater shortage. They do not necessarily indicate any current shortage or imply any immediate administrative actions.” Again, they provide a snapshot in time. Groundwater systems are dynamic, especially in places where groundwater is managed in tandem with surface water.
Some basins are small in size while some are expansive. Some have a lot of water and some have very little. Some are interconnected with other basins. Some are not. Even the boundaries of each basin is a matter of dispute, something the Nevada Supreme Court could decide on one day soon. The point is: How each area responds to the use (or overuse) of groundwater use can vary quite a bit, and the effects can be extremely localized. But the maps provide a starting point to look at some of the issues at play.
Waiting for snow
After a huge snowpack last year, 2024 is starting well below average across much of the West. This matters because snowpack acts as a natural storage reservoir for many watersheds in the region. As snow melts, water steadily finds its way into our rivers.
In California, the Division of Water Resources reported the statewide Sierra Nevada snowpack to be the lowest in 10 years. More from the San Jose Mercury News. But the good news for the water supply is still in what happened last year: There remains a lot of water stored reservoirs. And there are several months left in the year for big storms.
Here’s what things look like so far for the Colorado River.
A big takeaway: “Lots of data, lots of research, projections, modeling, all point to this continuing trend of warmer winters, less snow and in some cases, less precipitation.”
In other news:
The Sites Reservoir, slated to become California’s largest new storage projects in decades, is the subject of a legal challenge as environmentalists argue the dams will cause harm to the Sacramento River ecosystem, Courthouse News reported.
Found this article sobering: The Pacific Institute found that global conflict around water on the rise from Ukraine to the Middle East. The institute tracked nearly 350 incidents in 2022 and the first half of 2023, the Los Angeles Times reported. Notably, many of the documented incidents were on water infrastructure used by civilians.
A good profile on Colorado’s top Colorado River negotiator, from the Colorado Sun.
California approved a long-discussed project to bypass the Sacramento-San Joaquin River Delta amid opposition and a tough road ahead, the Sacramento Bee reports.
What to watch on the Colorado River this year, from The Water Desk.


