


The U.S. water supply, visualized
New USGS assessment highlights water availability.

Hello, and happy Friday! Welcome to Western Water Notes.
To get all my posts in your inbox, click the button to subscribe below. This newsletter is free, but if you find my work valuable and want to support it, please consider the monthly or yearly subscription plans. You can also support my work by sharing these posts with friends or on social media. As always, drop me a line with feedback, ideas for posts, and suggestions.
The U.S. Geological Survey released a water assessment on Thursday that found about 27 million people in the United States live in areas with high to severe levels of water scarcity. Although the agency has studied water quantity and quality in the past, this assessment was the first time that they integrated the two into one. The study further found that people living in water scarce area tend to be more socially vulnerable.
More people living in areas with high water limitation were socially vulnerable compared to those living in areas with lower water limitation and more available water. With the United States facing growing challenges related to water availability, the assessment provides key insights into understanding where shortages exist, where surpluses can be found and the quality of the water.
“This assessment is a crucial part of the USGS’s commitment to understanding and reporting on water availability, a growing concern in the face of increasing challenges to this vital resource,” said David Applegate, USGS Director.
One of the most striking things to come out of the study were visualizations and maps that provide snapshots of water issues across the United States during the assessment period (2010-2020), a period marked by extreme weather amplified by climate change.
I wanted to share some of those findings here:
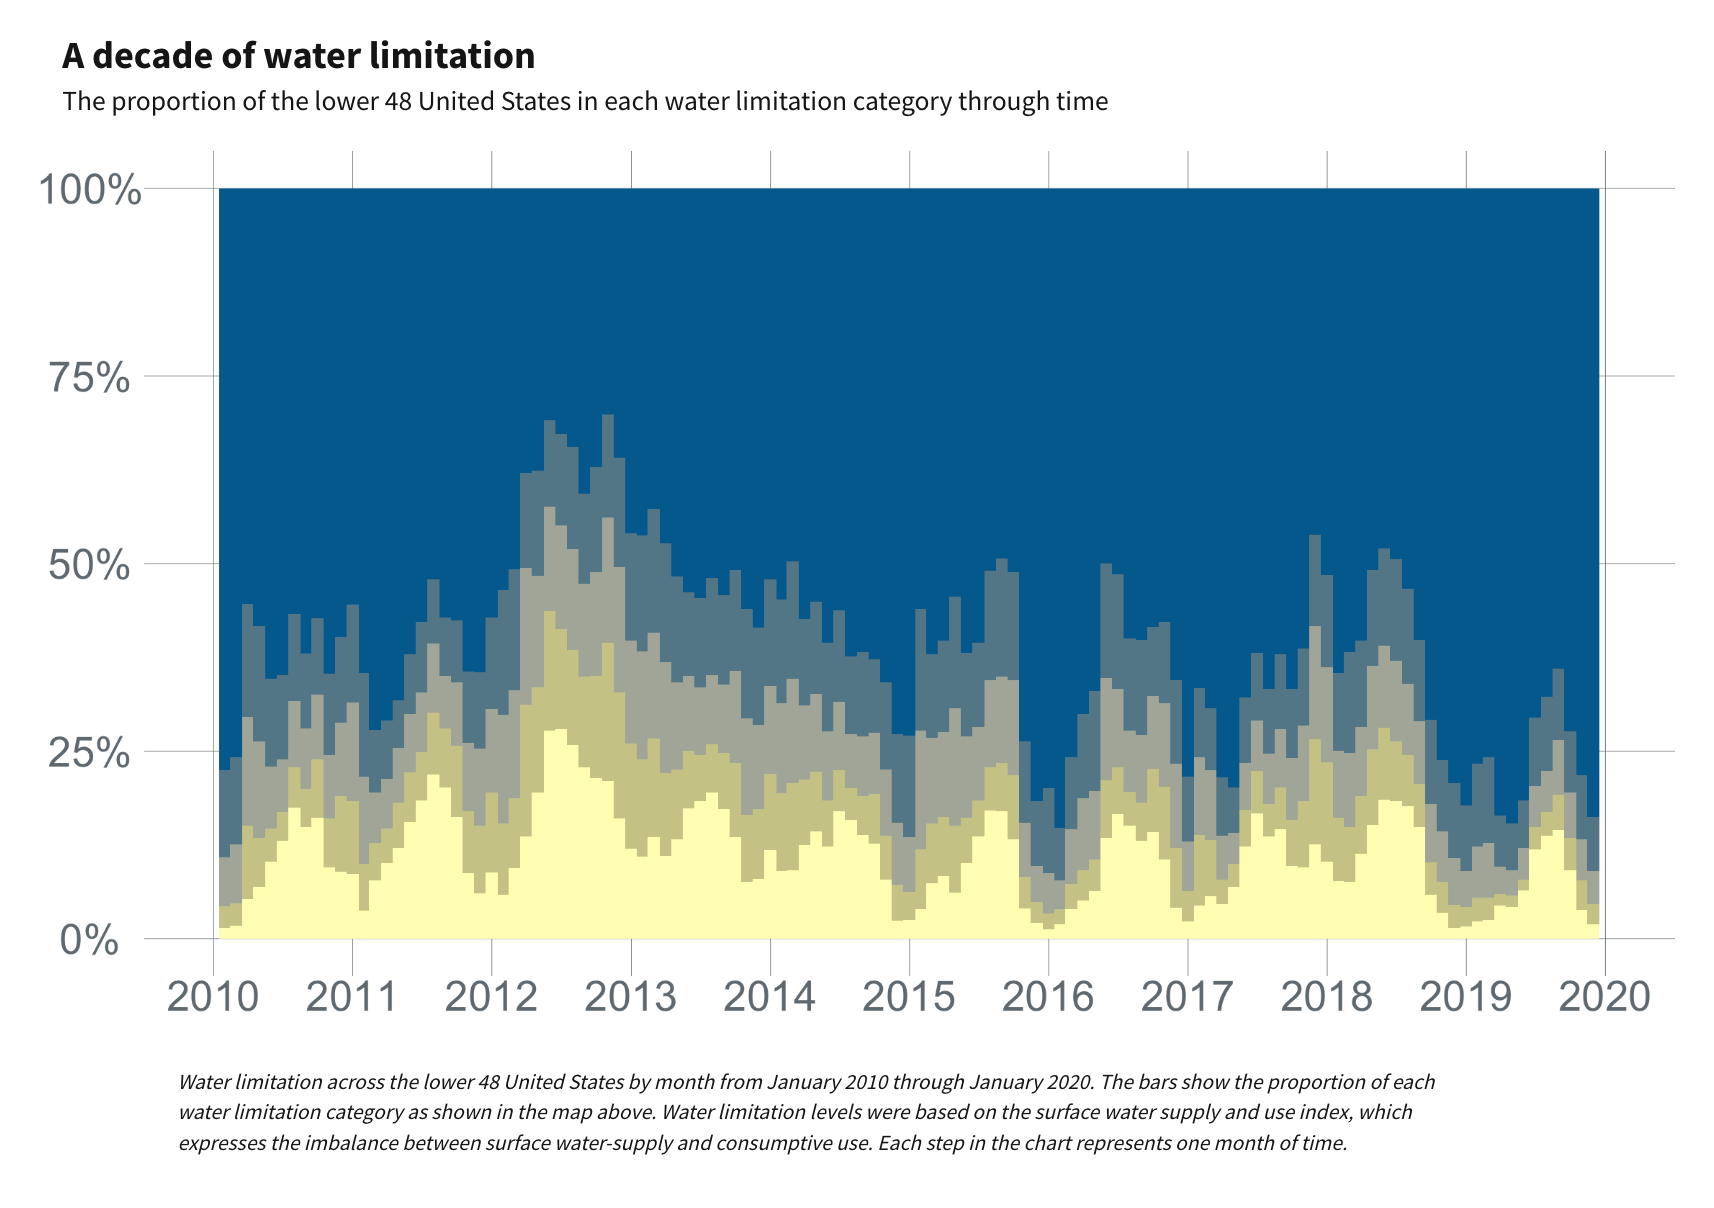
1. Water limitation and demand

This first map shows the imbalance between surface-water supplies (it is worth noting that groundwater is excluded) and who much water is consumed. The study also found limitations vary based on season and drought conditions — not all that surprising. But what I did find interesting was the report note that supply is only a part of the picture. Demand also tends to rise during drought, with irrigation use reaching a peak in 2012.
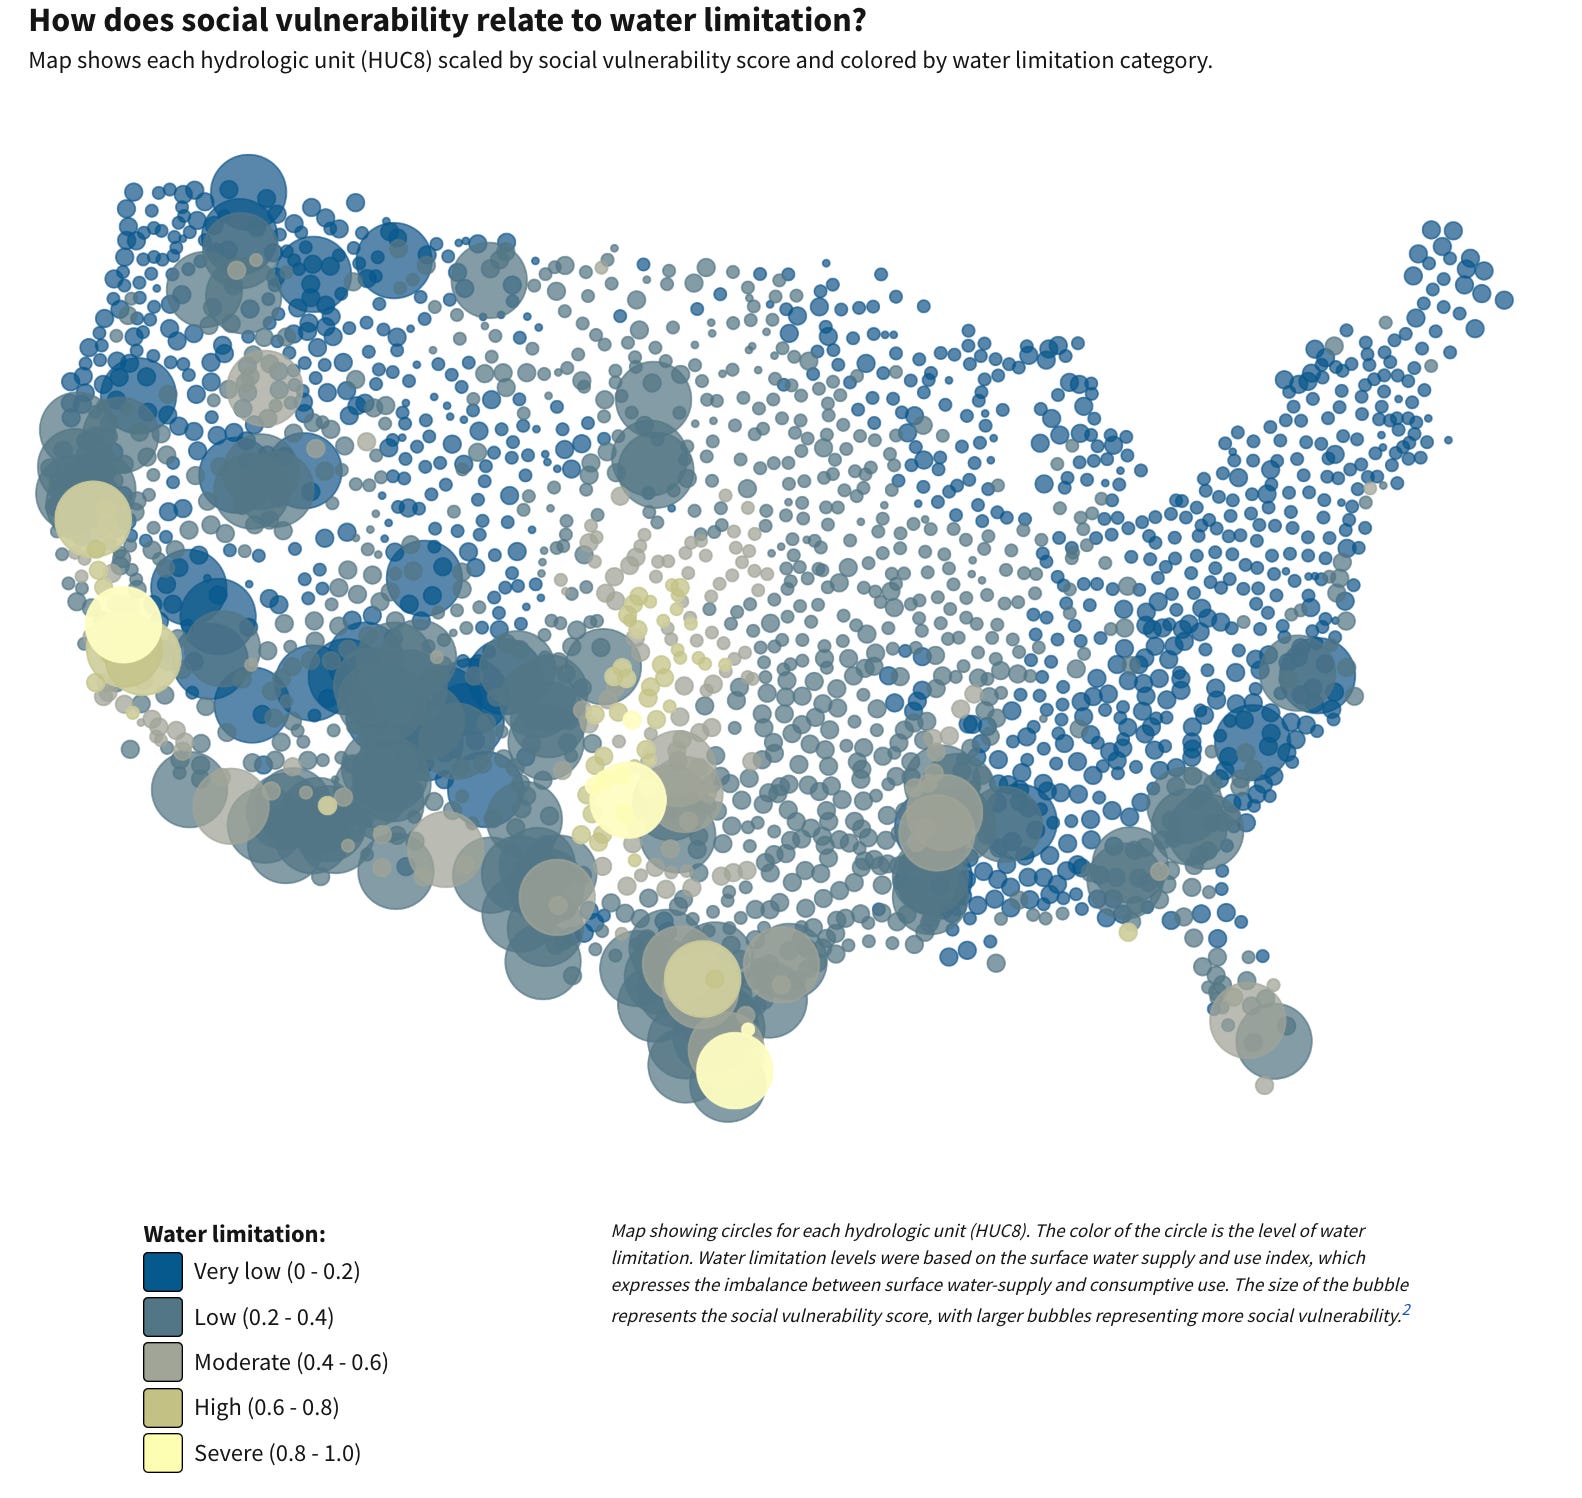
2. Water inequality
The report finds that about 27 million people in the U.S. (or 8% of the population) live in areas with high to severe water scarcity. And in many places in California, Texas and the Southwest, these areas of water scarcity overlap with social vulnerability, as defined by the Centers for Disease Control Social Vulnerability Index (SVI). This map looks at water scarcity (color of the circle) and social vulnerability (size of the circle).
3. How water is used
This is fairly self-explanatory but takes a look at how water is used across the United States. Highly recommend looking at the chart below it, which breaks down regional differences in groundwater vs. surface water use for public water supplies.

Another great visual in this set looks at regional concentrations and causes of nitrogen and phosphorus concentrations. Another excellent one on water quality.
A few other threads:
UCLA released an analysis concluding that climate change contributed roughly a quarter of the extremely dry vegetation that was one of the primary drivers taht made L.A. so susceptible to the devastating wildfires (L.A. Times).
“When ‘good’ is not good enough:” Colorado River researchers John Fleck and Jack Schmidt look at the need to further reduce use in the watershed, and how that priority is entangled with individual interests. A great line from the post:
“As Elinor Ostrom noted in her classic book Governing the Commons, shared understanding of the resource is crucial to successful water management. Increasingly, areas of uncertainty have become contested ground, as the genuine technical uncertainties collide with the motivated reasoning of political actors across the basin.”
In Nevada news (I missed this a few weeks ago), the Atlantic Richfield Company, which is responsible for cleaning up the contaminated Anaconda Copper Mine in Western Neavda (deferred from a Superfund listing during Trump’s first term), is seeking to privatize land on the mine site that currently belongs to the Bureau of Land Management (Nevada Appeal). A mining watchdog group has argued that the sale could reduce the transparency of the cleanup and more easily lead to re-mining. Some background from a story for The Nevada Independent in 2020.
Another water district backs California’s Delta tunnel plan (Mercury News)
Words for the weekend
Came across this Mary Oliver writing the other day, and it spoke to me when it comes to thinking about water and the many ways that it connects us. Hope you enjoy it:

Awesome maps and graphs!